See our paper on this topic: Delacre, M., Lakens, D., & Leys, C. (2017). Why Psychologists Should by Default Use Welch’s t-test Instead of Student’s t-test. International Review of Social Psychology, 30(1). https://doi.org/10.5334/irsp.82
New preprint explaining why Hedges’ g*s based on the non-pooled standard deviation should be reported as the effect size alongside Welch’s t-test, with Shiny app and R package to perform the calculations: https://psyarxiv.com/tu6mp/
Take home message of this post: We should use Welch’s t-test by default, instead of Student’s t-test, because Welch's t-test performs better than Student's t-test whenever sample sizes and variances are unequal between groups, and gives the same result when sample sizes and variances are equal. A widely recommended approach in textbooks where you first test the assumption that variances are equal with Levene’s test is a waste of time – just always use Welch’s t-test. Levene’s test often has low power, and will therefore fail to reject the null-hypothesis that variances are equal (even when variances differ), which makes it problematic to accept the null hypothesis of equal variances.
Take home message of this post: We should use Welch’s t-test by default, instead of Student’s t-test, because Welch's t-test performs better than Student's t-test whenever sample sizes and variances are unequal between groups, and gives the same result when sample sizes and variances are equal. A widely recommended approach in textbooks where you first test the assumption that variances are equal with Levene’s test is a waste of time – just always use Welch’s t-test. Levene’s test often has low power, and will therefore fail to reject the null-hypothesis that variances are equal (even when variances differ), which makes it problematic to accept the null hypothesis of equal variances.
Less work
is always better. Here, I’ll explain how you can replace interpreting two
statistical tests (Levene’s test for the equality of variances and Student’s t-test for differences between groups),
by one test: Welch’s t-test (also
known as the Satterwaite’s test, or the Smith/Welch/Satterwaite test, or the
Aspin-Welch test, or the unequal variances t-test).
Levene’s
test is used to test for one of the assumptions of a t-test, namely that the variances of the two populations are equal.
If sample sizes in both conditions are equal, the t-test is very robust against unequal variances. If sample sizes
are unequal, unequal variances can influence the Type 1 error rate of the t-test by either increasing or
decreasing the Type 1 error rate from the nominal (often 0.05) alpha level.
The R code below examines the Type 1 error rate of a hypothetical study where
38 participants were assigned to condition X, and 22 participants were assigned
to condition Y. The mean score on some DV in both groups is the same (e.g., 0), so there is no effect, but the standard deviations between groups differ, with the SD in condition X
being 1.11, and the SD in condition Y being 1.84. So are the sample sizes in
this hypothetical example unequal enough to lead to concern? Are the variances
in these groups (the standard deviations, squared) different enough to cause
bias?
I've simulated 50000 studies (which takes a while, so the number of simulations in the script is set to 5000 instead), where the R code performs a Student’s t-test
(in R specified with the argument var.equal=TRUE), a Welch’s t-test (in R actually the default (!)
but also specified with the argument var.equal=FALSE), and Levene’s test, and
stores the p-values for these three
tests. It then plots the p-value distributions, creates a scatterplot, and calculates the power of Levene's test. We should observe a uniform distribution of p-values because the null-hypothesis is true, with 5% of the p-values being smaller than 0.05, even
though there is no true effect.
It is clear
that this is not the case for Student’s t-test.
We see a skewed distribution, with more p-values below 0.05 than there should
be (in this example, the true Type 1 error rate is 8.4%, which is already far enough from the nominal 5% level to be problemantic).

Welch’s t-test doesn’t flinch, and performs just
as desired.

We can plot
the p-values against each other. Dots fall on the red line when both tests return the same p-value. If the two group sizes are equal, all points fall on this
line. Remember unequal variances are only a problem when group sizes are
unequal. The top left quadrant are all p-values
smaller than 0.05 according to a Student’s t-test,
but higher than 0.05 according to Welch’s t-test.
Since Welch’s t-test maintains the
nominal Type 1 error rate with unequal variances, the p-values in this quadrant represent the bias in Student’s t-test when groups are unequal and
variances are unequal (i.e., the studies that yield a p < .05 with Student's t-test, but not with Welch's t-test).

The bias
works both ways. In the example above, the condition with the larger sample
size had the smallest standard deviation. But when the condition with the
larger sample size has the larger standard deviation, the Student’s t-test can return a p-value higher than 0.05, when Welch’s t-test returns a p-value
smaller than 0.05 (there is a dip in the number of p-values < 0.05 in the p-value distribution of Student’s t-test, and the majority of the data
points fall below the red diagonal line).
You might
argue that as long as Levene’s test warns you that variances are not equal,
there is nothing to worry about. If we examine how often Levene’s test is significant,
we see it has a statistical power of only 63% with the sample sizes and
standard deviations in this example. Even though the variances in our
simulation are not equal, Levene’s test only reveals this difference in 63% of
the tests. The power depends on the size of the difference in variances (the
bigger, the higher the power), and on the sample size (the larger, the higher
the power). That is assuming that people check the assumptions of the t-test to begin with, and report Welch's test when Levene’s test is significant.
Unless you
have a very high power (and feel free to use the simulation to calculate what
your power would be, given your sample size, for a range of plausible standard
deviations), there is no way to be reasonably sure that variances are equal. If
we think about the masses that religiously chant ‘the null is always false’
(ahum, random assignment to conditions, anyone?) it is surprising that people
do not universally reject the idea that the variances in two condition are
equal. Unless you can convincingly argue the difference between groups does not
influence the standard deviation (good luck with that), it seems quite
reasonable to doubt this assumption.
If
variances are equal, Welch’s t-test
and Student’s t-test return the same p-value. But Type 1 error rates are only one factor to evaluate a test on. The second most important factor is statistical power (with ease of calculation being a third, but Welch's test is always reported in SPSS, so that's not a problem). If one test is much more powerful than the other, it can be considered a better test. Moser, Stevens, & Watts (1989) find that Student's t-test is only slightly more powerful when variances are equal but sample sizes are unequal. When the difference between sample sizes is huge (e.g., 20 vs 2000 participants) the Student's t-test is a few percent (e.g., 4%) more powerful. However, in most other situations, the difference in power is between 1 and 2 percent, which can be mitigated by just a few (sometimes even 1) additional participant(s) in the smaller group. The only other situation where the Student's t-test is more powerful is when variances and sample sizes are unequal and the larger group has the smaller variance, but in this situation, the Type 1 error rate is inflated in the Student's t-test, so it's not really an option anyway. These power differences are therefore not a strong reason to ever use Student's t-test instead of Welch's t-test, unless you can be confident variances are exactly equal.
The idea that a two-step procedure (first performing Levene's test, then deciding which test statistic to report) should be replaced by unconditionally reporting Welch's t-test is generally accepted by statisticians, but the fool-hardy stick-to-what-you-know ‘I’m not going to change if others are not changing’ researcher community seems a little slow to catch on. But not you.
The idea that a two-step procedure (first performing Levene's test, then deciding which test statistic to report) should be replaced by unconditionally reporting Welch's t-test is generally accepted by statisticians, but the fool-hardy stick-to-what-you-know ‘I’m not going to change if others are not changing’ researcher community seems a little slow to catch on. But not you.
If you have
made it to the end of this post, I know you care about doing things right. The
recommendation to always perform Welch’s t-test has not made it to all our
statistics textbooks yet, but it has made it to R, where Welch’s test is
returned by default (and Student’s t-test has to be requested by specifying
var.equal=TRUE). If you start reporting Welch’s t-test, you can reference Moser & Stevens, 1992 (non-paywalled version) who
explain why Welch’s test should always be used very clearly, or if you prefer a
strong statement, cite Ruxton, 2006 (open access) who says: “If you want to compare the
central tendency of 2 populations based on samples of unrelated data, then the
unequal variance t-test should always
be used in preference to the Student’s t-test
or Mann–Whitney U test.” (As long as data is normally distributed – if not, use
robust statistics, see Wilcox, 2012). Similarly, Hayes and Cai (2007, p. 237) conclude: "Our findings are consistent with those of others who have reported that the conditional decision rule serves little useful function and may as well be abandoned (Best & Rayner, 1987; Gans, 1981; Moser & Stevens, 1992; Wilcox et al., 1986)." It is not necessary to provide a reference if you use Welch's t-test, because it can easily be recognized by the different degrees of freedom it has, typically not a round number (e.g. not 57, but 25.13).
When you have unequal group sizes, and Welch’s t-test is significant but Student’s t-test is not, it is easy to make the correct choice. But next time you see the SPSS output below, stay strong. Always report Welch’s test for unequal variances.
When you have unequal group sizes, and Welch’s t-test is significant but Student’s t-test is not, it is easy to make the correct choice. But next time you see the SPSS output below, stay strong. Always report Welch’s test for unequal variances.

Still here? Then I guess you can handle the
formulas for Student’s t-test (mu’s
are the means, Sp is the pooled standard deviation, and n’s are the group sizes):

where the
pooled standard deviation is:

Welch’s t-test does not pool the standard
deviations, but divides the variance in each group by the size of that group,
as is clear from the formula below:

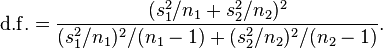
The formula for the degrees of freedom is known as the Welch-Sattertwaite-equation and is calculated by:
And finally, it is recommended to perform a Bayesian t-test to check whether any conclusions about rejecting the null-hypothesis converge with Welch’s t-test, and/or a robust t-test if you have reason to doubt that the data is normally distributed (an assumption that deserves its own blog post). For a practical introduction to robust statistics, see Wilcox, 2012.